Audio and acoustical measurement and analysis software
Delivers a complete suite of features geared towards professionals in the acoustics, live sound, and recording industries. By combining a complete toolset with an elegant user interface, FuzzMeasure Pro 2 lets you get all your work done without getting in your way.
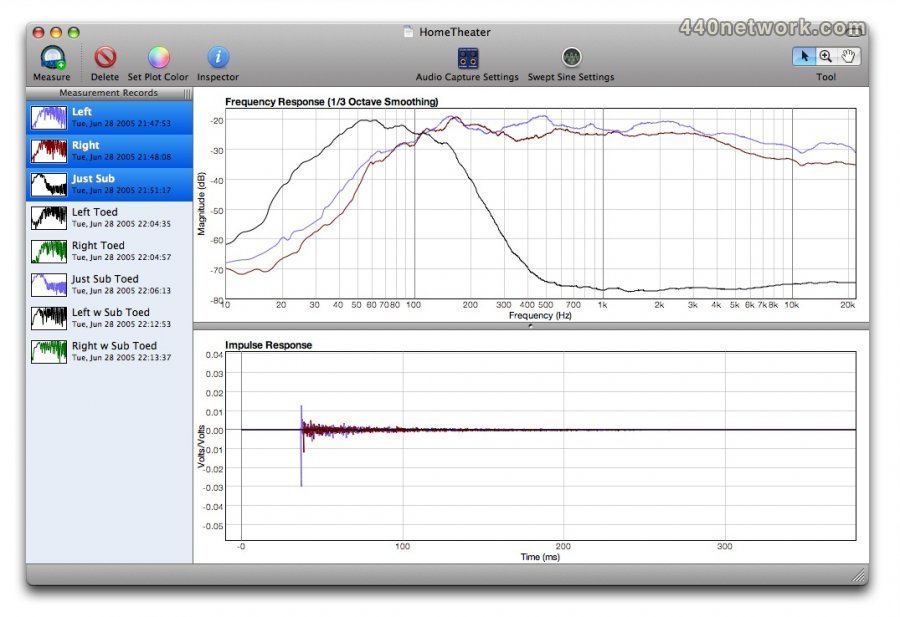
FuzzMeasure Pro is an audio and acoustical measurement application you use to perform, analyze, and produce visually stunning graphs of your measurements. Using FuzzMeasure's tools, you can easily gather measurements of a home theater system, recording studio, stage, auditorium, raw loudspeaker components, and more.
By accurately measuring the frequency response of a room or electrical component, FuzzMeasure reveals resonant frequencies, muddy bass, tinny treble, and other elusive, qualitative sonic properties. FuzzMeasure allows you to easily compare multiple responses side-by-side, which enables you to make incremental tweaks (moving furniture in a room, for example) and immediately see the difference.
FuzzMeasure's design makes a highly complex tool very easy-to-use. Whether you use FuzzMeasure as a hobbyist, or you work in the acoustics or audio field, you will appreciate the work that went into making it easier to get your work done. Download a copy and try it out for yourself!
 |
Version 3.2.4 |
MacOS X UB |
(App) |
Oct 29, 2011 |
Not available
 |
Version 3.2.3 |
MacOS X UB |
(App) |
Oct 27, 2010 |
Not available
 |
Version 3.2.2 |
MacOS X UB |
(App) |
Aug 19, 2010 |
The largest change in this release is an important one, as I believe I may have finally found a 'silver bullet' to deal with widespread confusion about FuzzMeasure's results. Now, FuzzMeasure will fail gracefully when a measurement is captured incorrectly, rather than giving you bad data.
You see, I get a lot of support emails from customers who are new to FuzzMeasure, and acoustic measurements in general. In many cases, their misunderstanding stems from the fact that FuzzMeasure will happily let you measure silence, and give you a meaningless graph.
Not any more!
FuzzMeasure now checks and ensures that there is a distinct impulse peak that should be well above the noise floor of a signal. This serves as a built-in failsafe that will force you to repeat measurements until you get your levels set up correctly.
Setting levels may be a combination of adjusting the volume of your amplifier to produce a louder input for your microphone, or changing the gain on your microphone preamplifier to pick up more signal. At any rate, you should be sure to use the Level Meter window to keep an eye on how quiet (or loud) your input is being picked up during the measurement.
In addition to this change, you can now also choose to normalize the impulse graph "post calculation." Just choose Impulse > Normalize from the main menu to enable this feature. This feature basically allows you to view the Envelope Time Curve and Log Squared Impulse Response with their peak at 0dB. Normalizing the record (Measurement > Normalize) would not necessarily guarantee this.
I also boosted performance considerably for users that find themselves viewing lots of Envelope Time Curve graphs. Because that calculation is very intensive, I now use a caching scheme that will stash already-calculated ETCs to disk for faster recall when switching between records.
 |
Version 3.2.1 |
MacOS X UB |
(App) |
May 15, 2010 |
Release notes not available
 |
Version 3.0 |
MacOS X UB |
(App) |
Nov 19, 2007 |
Release notes not available
 |
Version 2.0.11 |
MacOS X UB |
(App) |
Nov 3, 2006 |
Resolved cases in this release
- Feature 2057 — Normalize frequency response graph
Users may now apply a normalization operation to records, which normalizes the impulse response and allows for better comparisons between measurements taken at different volume levels.
- Feature 3820 — Remove icon bar from inspector window, add shortcut keys
Cleaned up the inspector window to allow greater flexibility and more obvious text to denote the contents of each inspector view. Also added shortcut keys to quickly access specific inspector views.
- Bug 3178 — Microphone calibration settings/records not saved between launches
Microphone calibration settings are now retained between launches.
- Bug 3516 — Y offsets for frequency/impulse graphs
Users can now offset graphs in the Y axis for individual records using the adjustment tool in the inspector (5th tab).
- Bug 3604 — Minor graph lines not close enough
Improved the spacing of graph lines so that they can get as close as 1 pixel apart, to show as much resolution as possible for easier at-a-glance graph reading.
- Bug 3605 — Labels on graph can get too close together
Added spacing between labels so that they don't get too close together.
 |
Version 2.0.8 |
MacOS X UB |
(App) |
Aug 31, 2006 |
Bug 2678: Waterfall plot draws slowly while rotating on PowerPC machinesWhile rotating the waterfall plot using the mouse on PowerPC machines, the display would update very slowly despite having a fast CPU and GPU. Waterfall plots now rotate much more smoothly. This fix also makes Intel-based systems redraw even faster than before.
Bug 2677: Waterfall plot labels not present on PowerPC-based systemsWhen displaying waterfall plots in FuzzMeasure Pro on a PowerPC machine, labels would not show at all, or show up garbled. This is now fixed.
 |
Version 2.0.6 |
MacOS X UB |
(App) |
Aug 27, 2006 |
- Users can now set the impulse response analysis window as short as 0.1ms for particularly quick impulse responses.
- Under certain conditions, automatic microphone correction would not take effect on channels that appear after a gap in the record channel list. This is now fixed.
- Users can now read values off the screen more easily in a single glance without resorting to adding markers, thanks to more lines getting drawn between text labels on the graph where appropriate.